
Regression Analysis 101: Essential Guide for New Attorneys in Pharmaceutical Antitrust
Introduction
In pharmaceutical antitrust litigation, econometric analysis, or regression analysis, is often relied upon to analyze data and provide insights related to claims of anticompetitive behavior.
The value of econometrics is that it allows one to draw inferences about economic relationships from observed data on market outcomes, even when those outcomes are the result of complex interactions among numerous economic forces…Econometrics can add substantial value to an antitrust analysis because it provides objective, scientific, and quantitative answers to key antitrust questions.
American Bar Association Section of Antitrust Law, “Econometrics: Legal, Practical, and Technical Issues,” Second Edition, 2014, p. 1.
This article provides useful information for attorneys navigating economic expert testimony in the pharmaceutical industry. It highlights the fundamentals of regression analysis, its applications in pharmaceutical economics, and some key interpretations and insights that can be derived. Designed for those new to the field, it highlights what every attorney should know to effectively engage with these critical tools.
Foundations of Regression Analysis
Regression analysis is a statistical tool used to identify and quantify relationships between variables, particularly to assess how changes in one variable influence another. It examines the relationship between a dependent variable (the outcome being studied) and one or more independent variables (factors expected to influence the outcome being studied). In pharmaceutical antitrust cases, the dependent variable often represents market outcomes such as drug prices, sales volumes, or market share.
The simplest form of regression is called a simple linear regression, which assumes a straight-line relationship between the dependent and independent variables. It can be expressed by the equation:
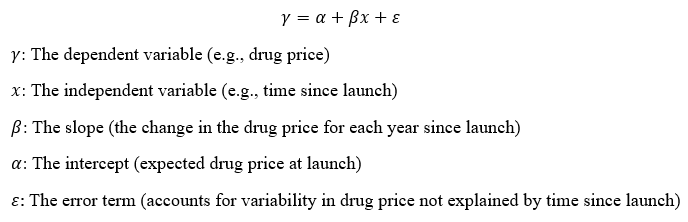
To illustrate, assume a simple linear regression was run on a hypothetical dataset of prices over time for a specific drug and resulted in the model below:
Price = $100 – $5 × Years Since Product Launch
In this equation, , the baseline price is $100, which means the drug launched at $100 ($100 – $5 × 0 Years Since Product Launch). Each additional year that the drug is being sold then decreases the price by $5 (beta). Of course, this simplistic model fails to account for the many factors that influence the price.
Applying Regression Models to Pharmaceutical Antitrust
Economic experts will often employ a multiple regression model, which is an extension of the simple model that incorporates multiple independent variables (e.g., time, number of competitors, cost) to analyze their combined effect on the dependent variable (e.g., drug price).
To assess antitrust injury and damages, economists will often use a multiple regression model to predict a “but-for” price, which represents the price that would have been observed, assuming that the alleged antitrust violation did not occur (and holding every other feature of the actual world constant). Assuming the model captures all relevant factors affecting price, the model can provide evidence of injury if the actual price is greater than the “but-for” price. Economists may then measure damages as the difference between these two prices. Conversely, if the actual price is less than or equal to the “but-for” price, the model fails to provide evidence of injury and damages may be zero.
For example, economic experts may use regression analysis in “pay-for-delay” cases to understand the price effects of an alleged delayed generic entry. These claims typically concern a brand-name manufacturer allegedly delaying generic competition by compensating a competitor to postpone the release of a generic alternative. In this case, for example, a regression may be used to analyze a drug’s price before and after generic entry — analyzing how the price changed from the period when a generic entered the market compared to when generic entry was allegedly delayed, accounting for all other factors that affect price. This analysis could test whether there is a difference between the prices consumers paid and what they would have paid had a generic entered the market earlier.
Regression analysis can also be used to estimate overcharges. Economic experts can measure the difference between actual drug prices and what prices would have been absent alleged conduct for a certain product (also called a counterfactual analysis). A regression might estimate the price increase attributable to anti-competitive behavior, using historical pricing trends and market conditions as predictors.
The equation below represents a regression model that might be proposed in pharmaceutical antitrust cases:
![]()
This model can account for supply and demand factors that may affect the prices of a pharmaceutical product such as time on the market, number of competitors, market size and share, and costs. The time period indicator (Beta1) represents the period of the alleged conduct and captures the effect on price beyond what is explained by the market factors included in the model — i.e., the overcharge.
Critically, in predicting a “but-for” price, economic experts should carefully assess what factors affect prices for the specific drug at issue rather than relying on a generalized industry-wide regression model that might be found in the economic literature. Such models are generally intended to measure average effects, but pricing dynamics may vary significantly across different drugs and at different points in time, reflecting unique attributes such as therapeutic class, regulatory considerations, firms’ strategies, and the competitive landscape.
In the case of pharmaceuticals, price determination is often more complex than typical consumer products. The "price" consumers pay for pharmaceuticals is not a single price dictated by simple supply and demand factors. Instead, it is determined by entities in each level of the supply chain, including insurers, plan sponsors, pharmacy benefit managers (PBMs), pharmacies, and other intermediaries. In theory, these factors are captured by the “Market Factors Affecting Price” variables in a regression model. However, in practice, measuring these factors poses significant challenges.
There are several idiosyncratic factors that make pharmaceutical price estimation difficult. For example, drug manufacturers may make substantial lump-sum rebate payments to various entities throughout the supply chain, which reduce net prices. If these rebates are paid to PBMs, the PBMs may pass on some portion of the payment to insurance providers, but it is often difficult to determine the amount that was passed on to a specific PBM client, which adds complexity to calculating actual net prices paid by those clients. These rebates can also vary across entities (e.g., different rebate amounts paid to different PBMs) and those differences may reflect strategic pricing decisions by the manufacturer.
Another idiosyncratic factor that may make it more difficult to assess impact and damages is the complexity in disentangling the effects of changes in insurance plan benefits from alleged anticompetitive behavior occurring simultaneously. For example, patients switching insurance from a low to high copayment plan may make it appear that they paid more when, in fact, the increase in their copayment was a result of a change in their insurance plan. Changes in formulary placement that are not associated with the alleged conduct may also affect out-of-pocket costs and make it difficult to separate the effects of the alleged conduct from the effects of non-accused factors. Economists must carefully distinguish the impact of alleged unlawful conduct from all other factors that affect the price paid by consumers.
Interpreting the Results from a Regression Model
In addition to predicting a “but-for” price, the model itself can also be used to draw insights. The effect of each independent variable can be analyzed. Economists will often look to the p-value to determine whether an independent variable has a statistically significant relationship with the dependent variable. Generally, a p-value less than or equal to 0.05 (5 percent) is considered statistically significant, which means there is a less than 5 percent likelihood of the relationship occurring due to chance.
The coefficients in a model represent the average effect of the independent variables on the dependent variable, holding other factors constant. The signs of the independent variables indicate whether the relationship is positive or negative. For example, in a model that predicts prices for a certain drug using market share and number of competitors, the coefficients of the independent variables can be interpreted on their own.
- A coefficient greater than zero indicates a positive relationship. For example, a positive coefficient on a market share variable implies that as market share increases, the average price increases (e.g., a larger market share to higher prices).
- A coefficient less than zero indicates a negative relationship. For example, a negative coefficient on the variable measuring the number of competitors implies that as the number of competitors increases, the average price decreases (e.g., increased competition leads to lower prices).
The value of the coefficients reflects the magnitude of impact on the dependent variable. For example, a coefficient of -0.50 for the number of competitors indicates that, on average, each additional competitor that enters the market reduces the drug price by $0.50.
Economists may assess model fit using statistics like R-squared, which shows how well the independent variables explain the variation in the dependent variable on a scale of 0 to 1. A higher R-squared value indicates a better fit. However, it should not be used as the sole determinant of the quality of a model as R-squared can be misleading. For example, R-squared increases as more independent variables are added, even if these variables have no meaningful relationship with the dependent variable.
Instead of relying on R-squared, it is important for an economic expert to conduct rigorous testing of a proposed model. For example, the average effects represented by regression coefficients assume the same effect across the sample (e.g., for all customers). However, the data may contain subgroups that have varying relationships between independent and dependent variables, causing the average effect to be inaccurate for some groups (e.g., the price effect of time since a drug first launched might differ between large retail pharmacy chains and small independent pharmacies). To determine whether the average effect is consistent across all observations, economic experts may perform tests such as the Chow test, which assesses whether the relationships differ significantly between subgroups or time periods.
Conclusion
When working with economic experts, it is helpful for attorneys to understand some of the fundamentals of regression analysis. The process of constructing a reliable model begins with studying the competitive environment for the drugs at issue, selecting the appropriate factors that comprehensively capture the relevant market dynamics, and compiling reliable data on those factors. Once the model is estimated, interpreting the results requires meticulous attention to the direction, magnitude, and statistical significance of the coefficients, which provide insights into how each factor affects the dependent variable. Additionally, economists should validate their models through rigorous testing. Economic experts should be able to explain in clear terms the rationale for each of the choices made during this process and the proper interpretation of the results.
Experts
 Principal Consultant